Skin Trading · Market Data
CS2 Skin Market Trends
See also: skins database, stickers, cases, market data, price tracker, weapon stats, guides, CS2 tools.
Real price movement, with the comparison window stated: top gainers and losers between our March 2, 2026 baseline snapshot and the current snapshot (October 21, 2026), plus the most traded, highest-volume, and most liquid skins from the past 7 days. For the full price index — most expensive skins, averages by rarity and category — see the price tracker.
Market Pulse: March 2, 2026 → October 21, 2026
Of the 1,185 skins with comparable prices in both snapshots (same wear, at least three wears matched, baseline price $1+), here is how the market moved.
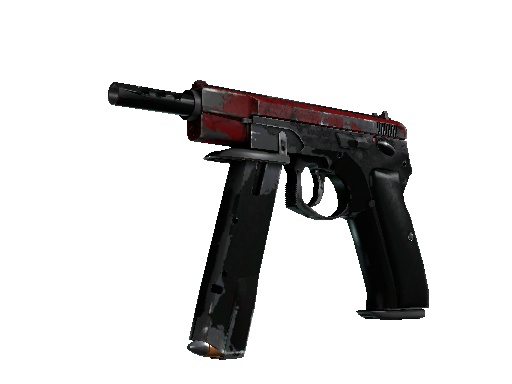
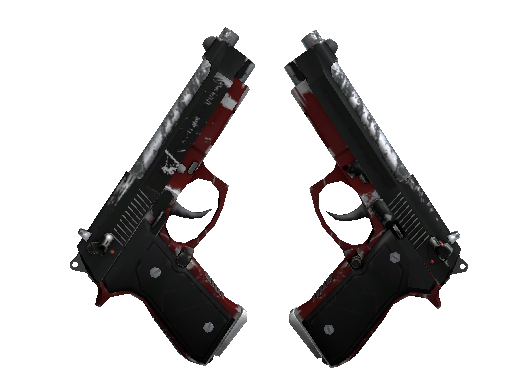
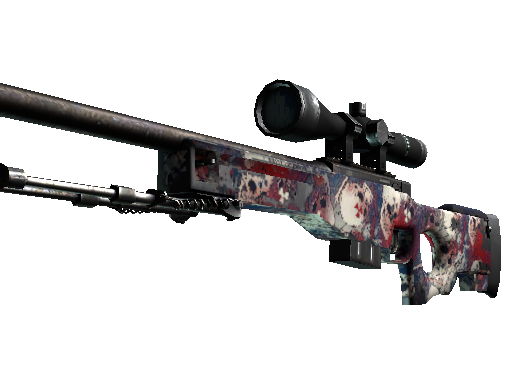
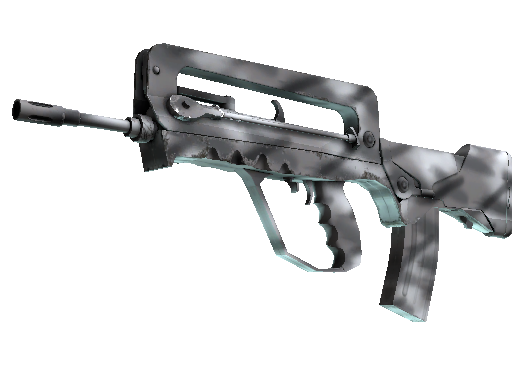
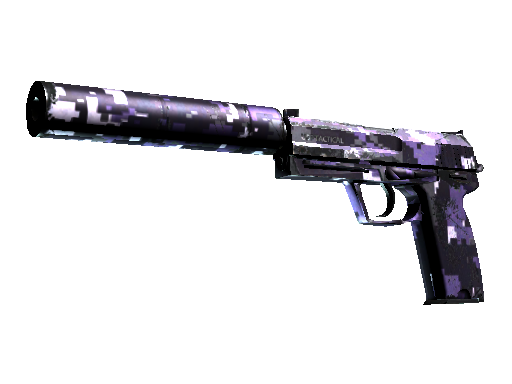
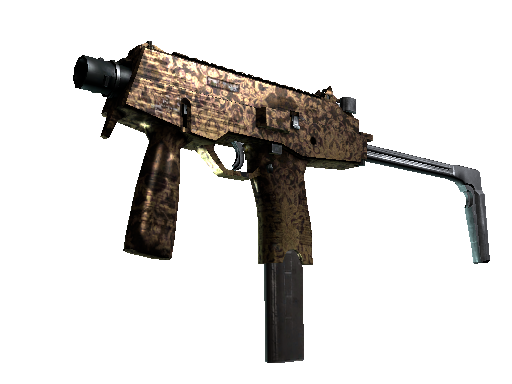
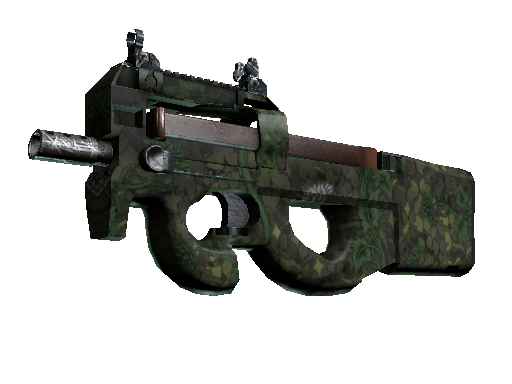
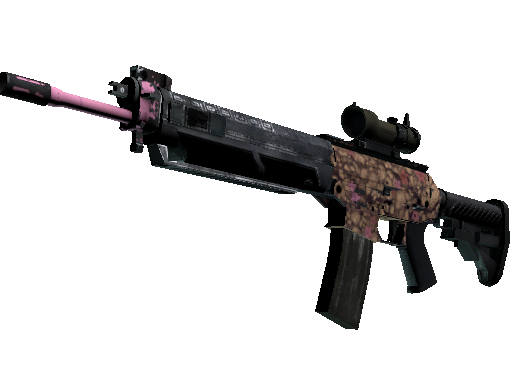
Top Gainers Since March 2, 2026
The biggest risers between the March 2, 2026 baseline and the October 21, 2026snapshot. The percentage is the median change across that skin's comparable wear conditions; the price shown is the wear that sits at that median.
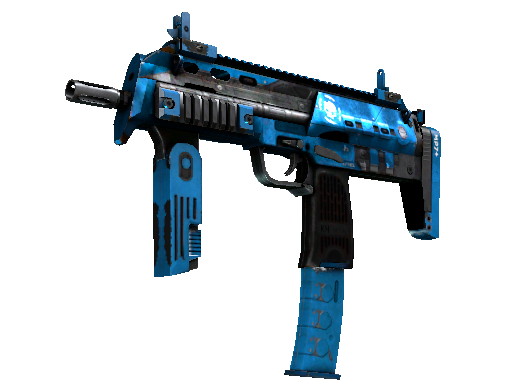
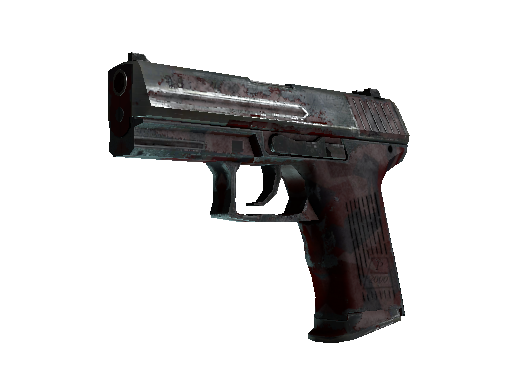
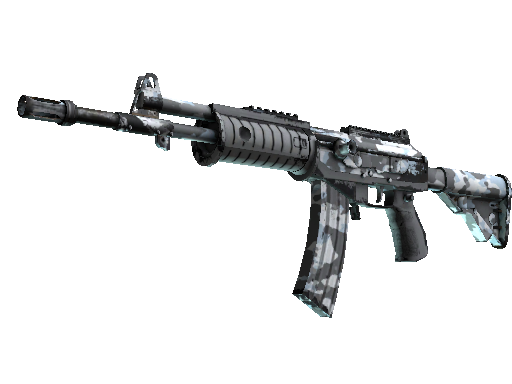
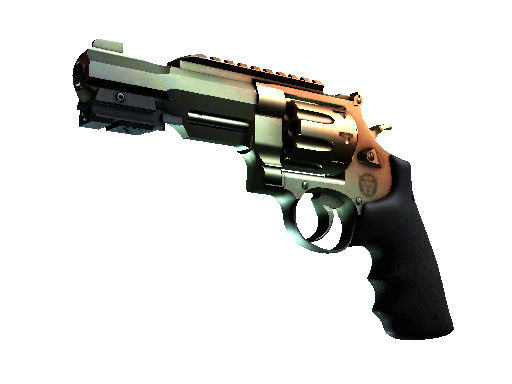
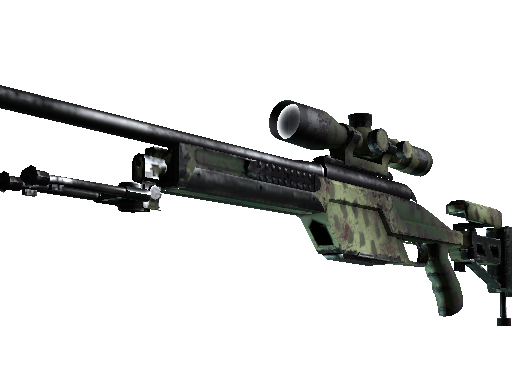
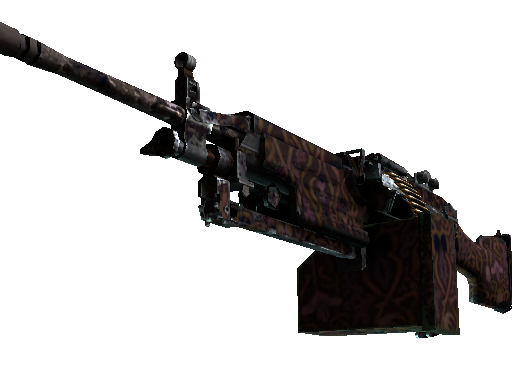
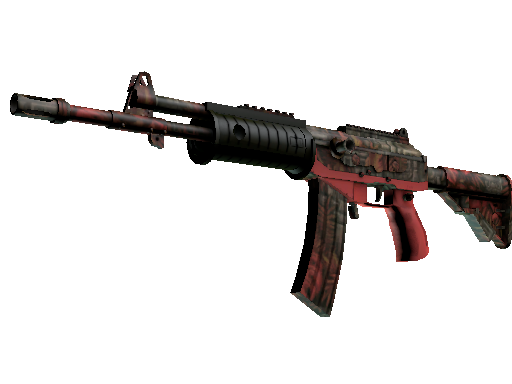
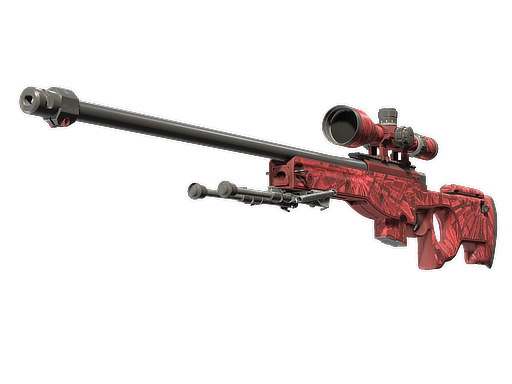
Top Losers Since March 2, 2026
The steepest declines over the same window, computed the same way. Broad declines in this table skew toward mid-tier and lower-tier skins, where supply is deepest.
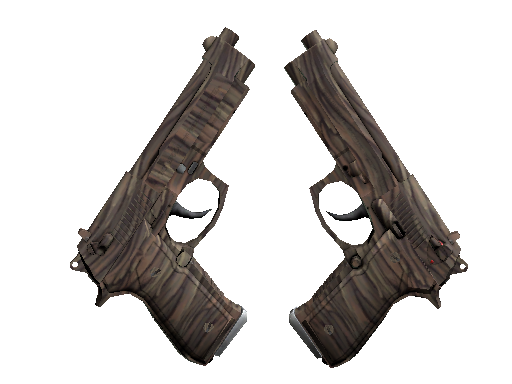
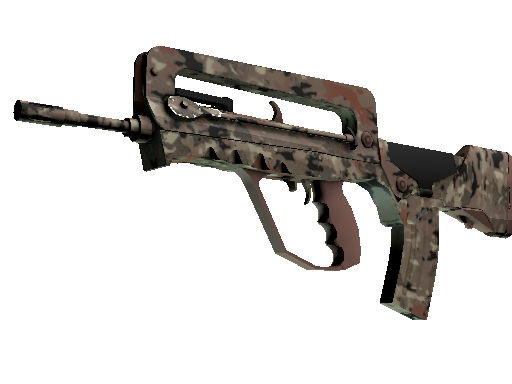
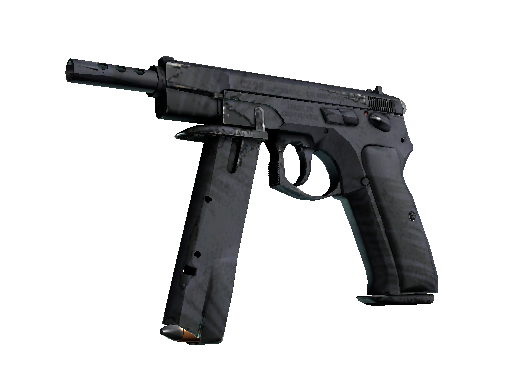
Median Change by Category
Median per-skin price change from March 2, 2026 to October 21, 2026, grouped by weapon category. Medians resist outliers, so these are a fair read on how each part of the market drifted.
What Moved the CS2 Skin Market in 2025–26
Skin prices do not drift randomly. The past year is the clearest demonstration in the market's history that a single Valve patch note can reprice billions of dollars of virtual items in a weekend. Two updates defined the period, and their aftershocks are still visible in the numbers above.
July 2025: the Trade Protection update
In July 2025 Valve introduced Trade Protection, a window during which traded items can be reverted to their original owner. The stated goal was fighting account hijacking and trade scams, and on that front it worked — but it also broke the instant-resale loops that many third-party marketplaces and cash-out services were built on. Items received in a trade could no longer be flipped immediately with certainty, so marketplaces had to adapt their escrow and delivery models. The short-term effect was a liquidity shock: spreads widened, some venues paused segments of their business, and prices wobbled while the ecosystem reorganized. The longer-term effect was structural — marketplaces that adapted (holding inventory through the protection window, adjusting seller payouts) recovered, and the market normalized around the new friction. If you compare marketplace prices today, part of the spread between venues still reflects who absorbed that friction best.
October 2025: the trade-up update, the knife crash, and the Covert spike
The bigger shock came in late October 2025, when an update to trade-up contracts made knives obtainable through trade-ups using Covert-grade inputs for the first time. Before that update, knives and gloves came from case openings alone — an extremely low drop rate that functioned as a hard supply constraint and underpinned their premium pricing. The update opened a second supply channel overnight, and the market repriced immediately and violently: knife prices crashed across the board as the scarcity premium evaporated, while Covert-grade skins spiked because every knife trade-up consumed them as inputs. Items that had been treated as slow-appreciating stores of value fell double-digit percentages in days, and skins that had been cheap red-tier filler suddenly had a demand floor under them. It was the clearest possible reminder of the market's single biggest rule: Valve controls supply, and no chart pattern survives a supply change.
What our own data shows since March 2, 2026
Our comparison window starts on March 2, 2026 — months after the October crash — and the numbers above show a market still cooling rather than rebounding. Roughly 99% of the 1,185 comparable skins are cheaper now than at the baseline, with a median change of -40.1%. The declines are broad-based: every weapon category's median is shown in the table above, computed from matched wear conditions rather than headline anecdotes. Knives and gloves — the categories whose supply mechanics changed in October 2025 — sit among the weaker medians in our window, consistent with continued post-update normalization. The gainers list, by contrast, skews toward older discontinued-collection skins, where supply genuinely cannot grow: no active case or collection drops them, so even modest collector demand moves the price. That split — abundant recent supply drifting down while scarce legacy supply holds or climbs — is the defining texture of the 2026 market so far.
The forces that move prices between the big shocks
Between headline updates, the same handful of forces do the everyday work. Case and collection rotation is the steady one: when Valve retires a case from the active drop pool, its skins stop being minted and slowly appreciate as items are consumed by trade-ups or locked in inventories. Esports visibility is the fast one: a pro player showcasing a particular skin at a Major can move its price within days. The wear-and-float economy is the subtle one: two copies of the same skin can differ in price by multiples based on float value alone, which is why every comparison on this page matches wear conditions rather than mixing a Factory New listing against a Battle-Scarred one. StatTrak and Souvenir variants trade on their own supply curves. And underneath all of it sits Steam wallet friction — money that enters the Steam ecosystem cannot easily leave it, so third-party marketplace prices (which settle in real money) run structurally below Steam Community Market prices. Understanding that gap is half of trading well; our trading guide covers it in detail.
How to read this page honestly
A note on method, because trend pages are easy to fake and we would rather show our working. Every gainer and loser above is computed from two dated snapshots of the same SteamWebAPI feed, matching identical wear conditions, requiring at least three comparable wears per skin, ignoring sub-$1 baseline prices, and taking the median per-wear change — so one absurd single-listing ask cannot manufacture a mover. What this page does not do: it does not show intraday movement, it does not predict prices, and a four-month window says nothing about what happens next week. Use it to understand where the market has been, cross-reference individual skins on their own pages for per-marketplace prices, and if you are thinking about skins as a store of value, read the skins investing guide first — it is considerably more sober than most of what gets written about this market.
Best Value Skins
High-rarity skins (Classified/Covert) under $20 — great deals for collectors.
Knife & Glove Market
The highest-priced knives and gloves in the current snapshot.
Most Traded Skins (7 Days)
Skins with the highest number of trades in the past 7 days — the most actively bought and sold items.
Highest Volume Skins (7 Days)
Skins with the highest Steam market volume over the past week — strong indicators of market demand.
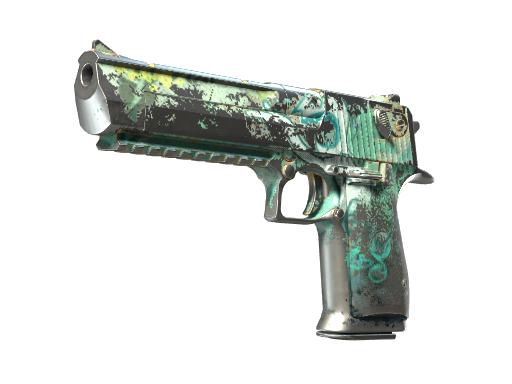
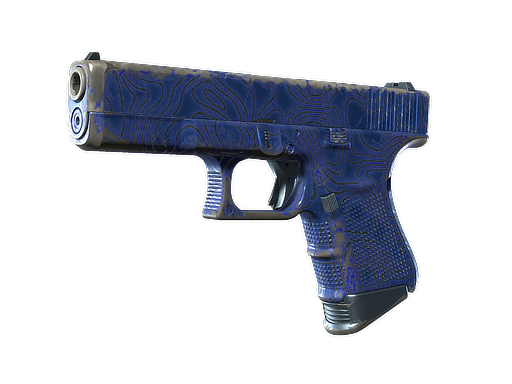
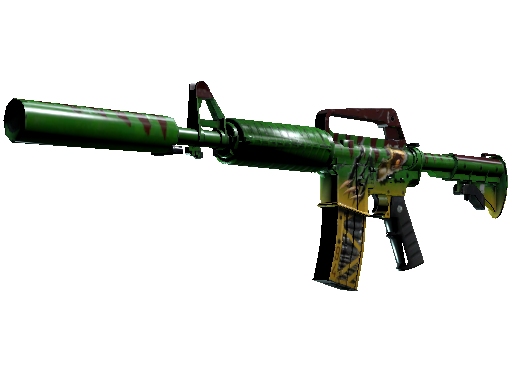
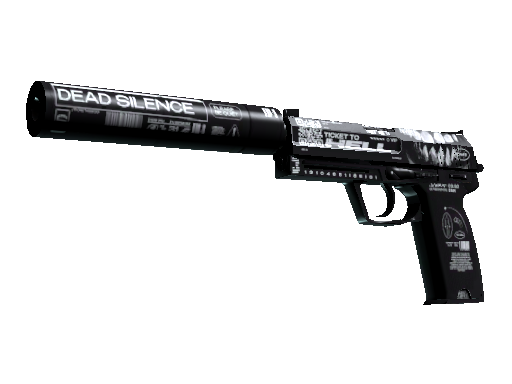
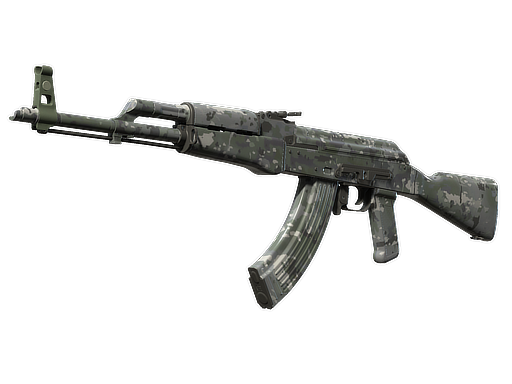
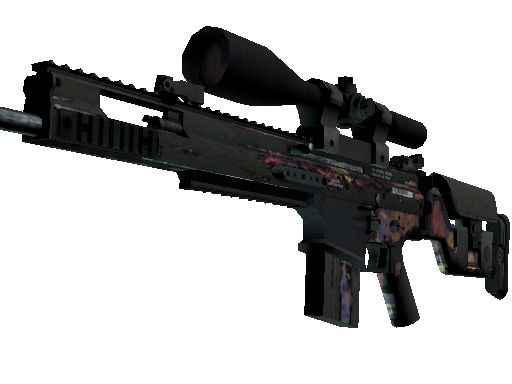
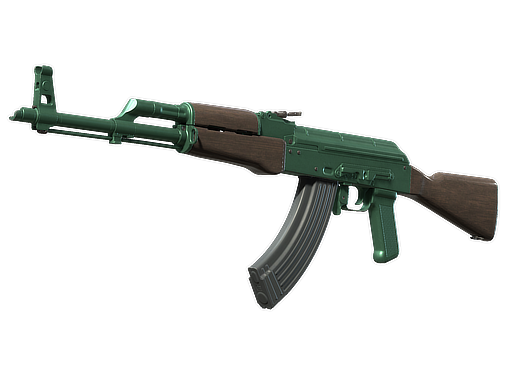
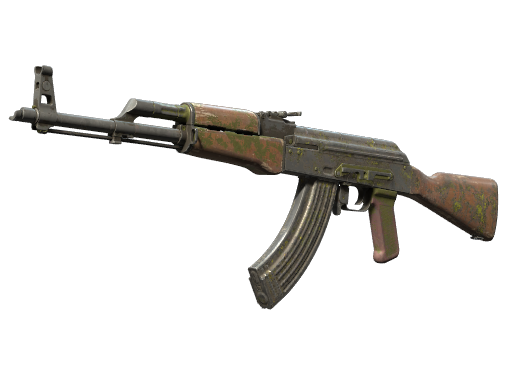
Most Liquid Skins
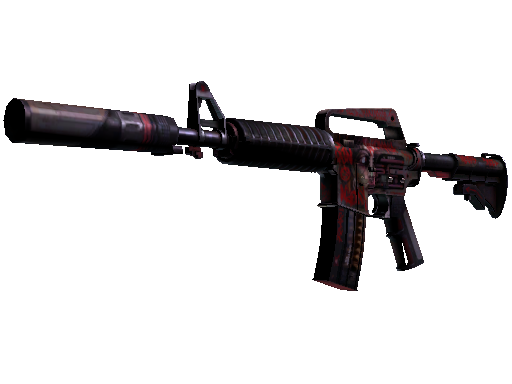
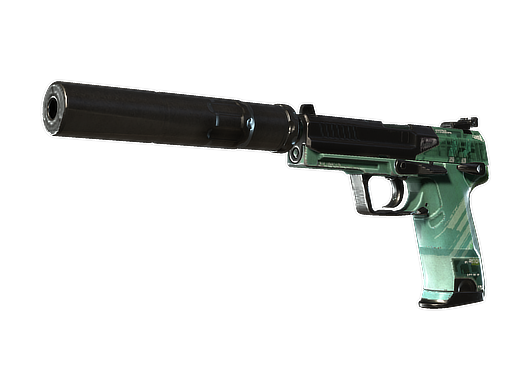
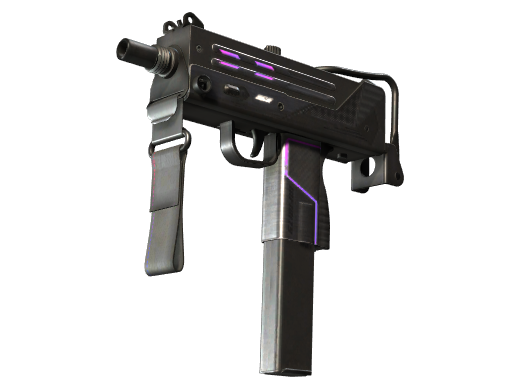
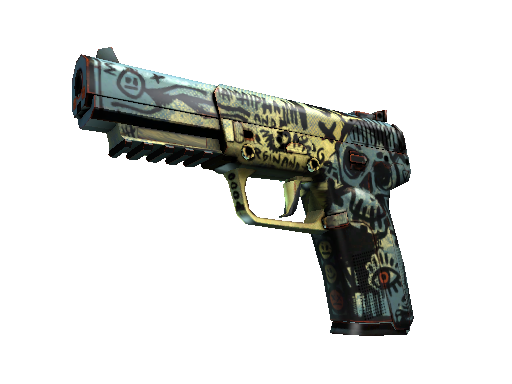
Skins with the highest liquidity scores — easy to buy and sell quickly at fair market value.

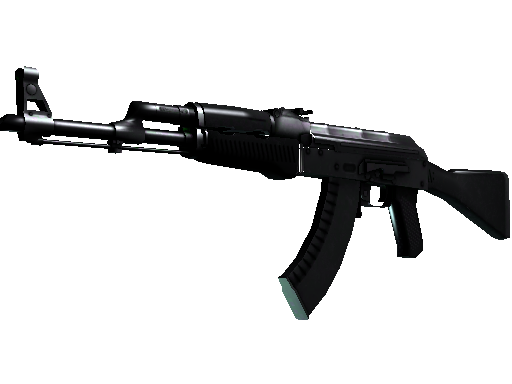
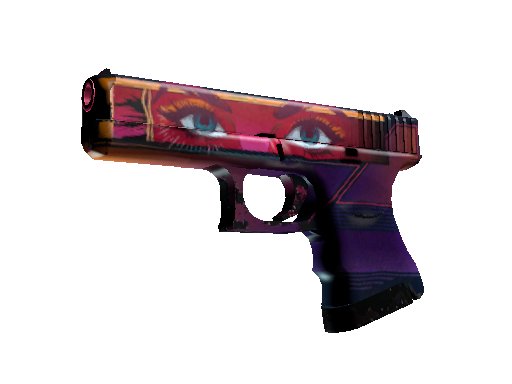
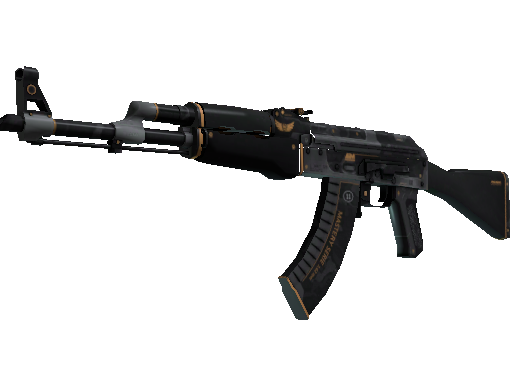
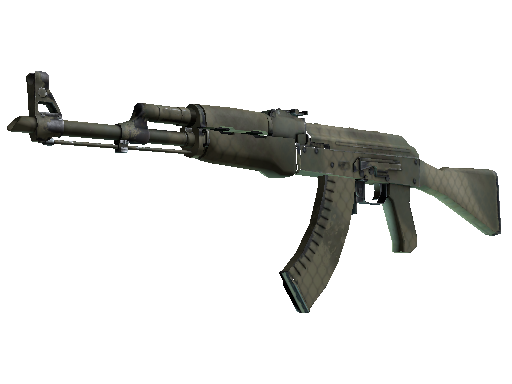
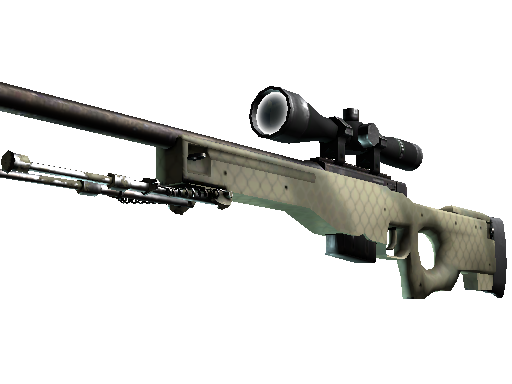
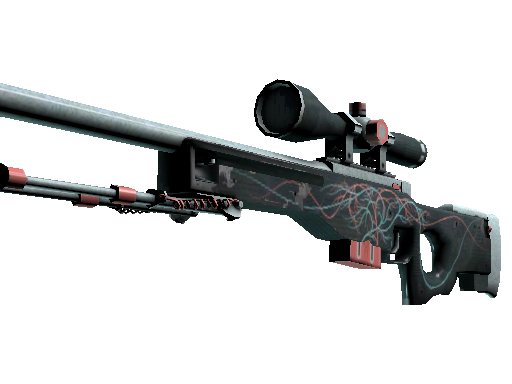
Most Listed Skins
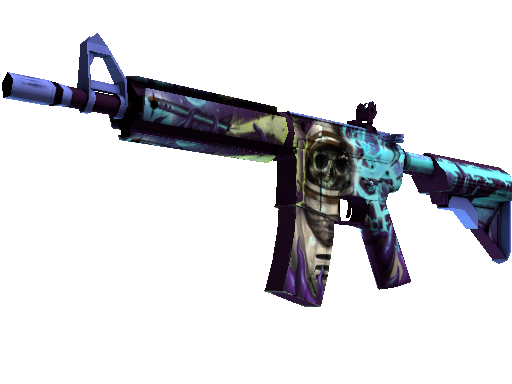
Skins with the highest number of active marketplace listings — reflects current market supply.
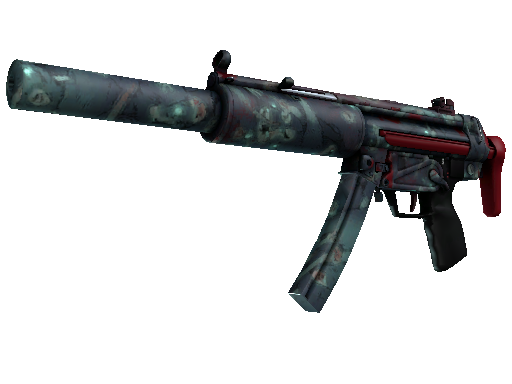
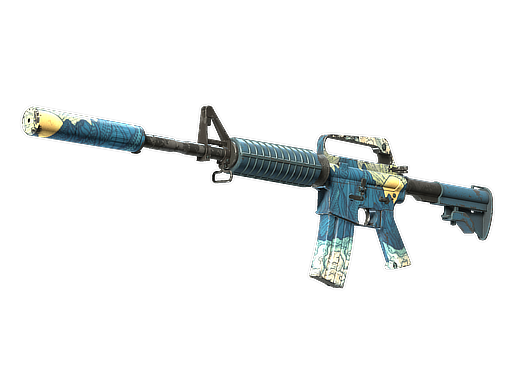

Frequently Asked Questions
- How are the top gainers and losers on this page calculated?
- We compare the current price snapshot (fetched October 21, 2026) against a fixed baseline snapshot fetched March 2, 2026. For each skin we match the same wear conditions across both snapshots, ignore wears that were under $1 at the baseline, require at least three comparable wears, and report the median per-wear change. The median rule means a single outlier listing on one wear cannot put a skin on the board.
- Where does the price data come from?
- Prices come from the SteamWebAPI feed, which aggregates listings from marketplaces including Buff163, Steam, Skinport, CS.Money, DMarket, BitSkins, CSFloat, and Waxpeer. The headline figure for each wear uses the Buff163 price when available, falling back to the lowest tracked marketplace otherwise. Per-marketplace breakdowns are on each individual skin page.
- What caused the big CS2 market swings in 2025?
- Two Valve updates dominated the year. The July 2025 Trade Protection update added a revertible-trade window that slowed instant resale flows and rattled third-party marketplaces. Then the late-October 2025 trade-up update made knives obtainable through trade-up contracts using Covert-grade inputs for the first time — knife prices crashed as the new supply channel opened, while Covert skins spiked as demand for trade-up inputs surged.
- How volatile is the CS2 skin market?
- Very, and unevenly. Discontinued-collection items have a fixed supply and their long-run price history reflects that, but a single Valve update can reprice entire categories overnight — October 2025 proved that. The moves on this page are measured against a fixed, dated baseline so they are comparable rather than anecdotal.
- How often does the data on this page update?
- The current-price side of every comparison refreshes with each site update — the snapshot shown now was fetched October 21, 2026. The baseline side is deliberately fixed at March 2, 2026 so the comparison window is always stated and reproducible rather than a vague "recent trend".
- Can I track a specific skin and get notified of price drops?
- We do not send notifications, but our free price watchlist lets you save any skin with a target price in your browser — each time you visit, your list is checked against the latest snapshot and drops are flagged. For a single skin, its own page shows current per-marketplace prices.